

Someone tells you the assistant said the wrong thing on Tuesday. They cannot remember the wording, they are fairly sure they asked twice, and they think it happened after they mentioned a price. You have a dashboard showing that Tuesday was unremarkable: error rate flat, latency inside its usual range, no alarm fired. Both of those things are true at once, and the dashboard is no help at all, because the question is not how the system behaved on Tuesday. It is what happened to this person.
That gap is what tracing is for, and most conversational systems are instrumented on the wrong side of it. They are measured as services, which they also are, rather than as conversations, which is where the failures people report actually live.
The system described here is a Humint Labs build. It is our own front door: a messaging and voice assistant that answers real enquiries, runs on managed model inference on Amazon Bedrock, calls tools, sits behind a policy guardrail, and is traced end to end. We designed it, we run it, and we instrumented it, which means we are also the ones who found the three defects in its instrumentation described further down. The companion piece on a governed toolset covers the audit record, what it must contain and why it is written on the request path. This piece is about the layer next to it: the span model, the unit of tracing, and what watching a conversation actually costs.
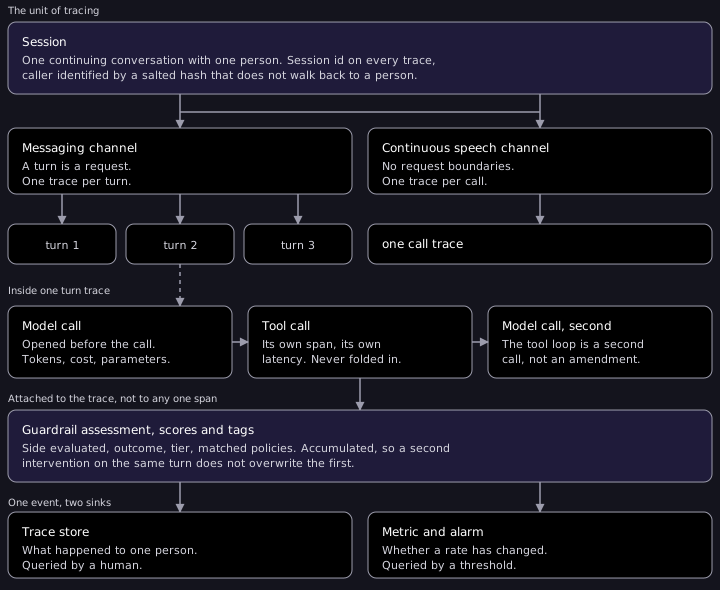
Every turn in this system passes through the same traced chain, one session, many traces: route, guardrail, model call, tool, reply. One trace is produced per turn, and that trace is where timings are measured, decisions are recorded and cost is attributed.
What tracing is actually for
A dashboard answers two questions well. Is it up, and is it slow. Those are the questions an operator asks at three in the morning, and a metric with an alarm on it is the right shape for both.
There are two more questions, and a dashboard cannot answer either. What did this person experience, turn by turn. And why did the system do that rather than the obvious alternative. A conversational system fails at the level of a turn, in ways that are individually invisible to an aggregate: a tool returned an empty result and the model narrated around it, a policy fired and the user read the refusal as the answer, a retrieval missed and the reply was fluent and wrong. None of those raise an error. None of those move a percentile. Every one of them produces a person who tells you the assistant said the wrong thing on Tuesday.
So the working definition. A span is a single timed operation with a name, a start, an end and a set of attributes describing what it did. A trace is the tree of spans produced by one unit of work, and it is the artefact that lets you replay that unit of work afterwards. A session is the sequence of traces belonging to one continuing conversation with one person. Getting the second and third of those right is most of the design.
What belongs on a span
The obvious way to instrument a model call is to log the prompt, the response and the elapsed time, and stop. It is fast, it is complete in the sense that nothing is missing, and it produces a trace store that cannot answer any of the interesting questions six weeks later.
Three rules do most of the work. The first is that the span opens before the operation, not after it. In our front door the model-call span is created ahead of the inference call so its start time is the real one. That sounds pedantic until a call times out: a span constructed after the fact has no way to record a start it never observed, so the slowest calls in the system are precisely the ones whose timing is reconstructed rather than measured. The pattern generalises. Open the span, do the work, close the span with what came back.
The second is that tool execution gets its own span rather than being folded into the model call that requested it. A turn that uses a tool is not one operation, it is three: the model decides, the tool runs, the model reads the result and answers. Collapsing those into a single timing gives you a number that goes up without telling you which of the three moved, and the answer is almost always the tool. Separating them costs nothing at write time and is the difference between a latency investigation that takes ten minutes and one that takes a day. The share of latency that belongs to tool execution is exactly the kind of figure this tracing shape makes measurable, and the only reason you can ask the question at all is that the spans are separate.
One thing worth doing before you invent your own attribute names. The OpenTelemetry project maintains semantic conventions for generative AI that already name most of what you are about to name: the operation being performed as `gen_ai.operation.name`, with well-known values including chat, execute_tool and invoke_agent; the provider as `gen_ai.provider.name`; and token usage split into input and output. Both of those attributes are still at Development stability rather than stable, and the token attributes have moved to a dedicated conventions repository, so this is not a settled surface you can lean on blindly. It is, however, the surface everything else will converge on, and the cost of naming your fields to match it now is nothing, whilst the cost of renaming a year of history later is not.
The third is that a tool loop produces a second model-call span under the same trace, not an amendment to the first. Two inference calls happened; two of them cost money and took time; the trace should say so. This is the point where cost attribution either works or quietly stops working, because a system that records one generation per turn will under-count every turn that used a tool, which is disproportionately the turns that did something consequential.
// The span opens before the call, so a timeout still has a real start time.
// A span constructed afterwards can only report a start it never observed.
const call = trace.generation({
  name: "answer-turn",
  model: MODEL_ID,                 // pinned, and checked against the price table
  modelParameters: inference,
  input: {
    system: truncate(systemPrompt, SYSTEM_PROMPT_LIMIT),
    messages: history.slice(-HISTORY_TURNS_ON_SPAN),
  },
  startTime: new Date(),
});

const response = await infer(request);

call.end({
  output: response.text,
  usage: { unit: "TOKENS", input: response.inputTokens, output: response.outputTokens },
  // Cost is computed here because the trace store does not know your rates.
  // See the price-table defect in the cost section: this is the line that
  // silently goes stale when the model tier changes.
  metadata: cost(MODEL_ID, response),
});
Attributes are where judgement is actually required, because every attribute is a retention decision wearing a performance costume. Our front door writes a truncated system prompt, the last few messages of history rather than the whole thing, and a truncated final reply. The tempting reading of that is a size optimisation. It is not. Truncation is the policy: it decides how much of a person's words end up in a second store with its own lifetime, its own access control and its own jurisdiction. If you write the truncation limit as a performance tweak, nobody will review it as what it is.
Why the session is the unit
Two things are true at once about the identifier on a trace, and they pull in opposite directions. You need to find every trace belonging to one person, or you cannot answer the question they asked you. You do not want their identity in the trace store, because a trace store is an analytics system with analytics access patterns and analytics access lists.
The resolution our front door uses is that the user identifier on a trace is a salted hash of the caller identifier, computed once and used consistently. The raw identifier never reaches the trace store and never reaches the logs. Given a person in front of you, you can recompute the hash and find their traces. Given the trace store, you cannot walk backwards to a person. That is a small piece of code and it is the difference between a trace store you can grant a support engineer access to and one you cannot.
The more consequential decision is the grain. Our two channels do not use the same one, deliberately. On the messaging path, a turn is a request: something arrives, something is computed, something is sent, and one trace per turn is the honest shape. On the continuous speech path there is no request. Audio flows in both directions for the length of the call, and a turn is something the system infers from silence rather than something the transport hands it, so the trace is one per call and turns appear inside it. Forcing a single grain across both would mean either fabricating request boundaries on the voice path or discarding them on the messaging path.
What makes that divergence safe rather than chaotic is that both channels write the same session identifier. The session is the join. A person who asks a question in messaging and then rings about the same thing is one session with two differently shaped traces underneath it, and the reconstruction still works. Choose the grain per channel to match the transport, and pay for that freedom by making the session identifier non-negotiable everywhere.
There is a failure attached to this, and it is ours. A per-turn score in our instrumentation records whether a tool was used on this turn. It is named for the turn, its own comment says this turn, and it is computed by scanning the whole conversation history held on the session. Once any turn in a session has used a tool, every later turn in that session scores as having used one. The metric only ever goes up, it never returns to zero, and nothing about it looks wrong on a chart. A per-turn field computed over session-scoped state is a specific and very repeatable mistake, and it is invisible precisely because the answer it gives is plausible.
A second score written in the same place fails more quietly, and it is the third of the three defects this piece owns up to. Alongside the tool-use score we write a latency score on the turn, and the comment above it describes a continuous normalised inverse: fast turns near one, slow turns approaching zero, everything in between placed smoothly along the curve. What the code does is sort the elapsed milliseconds into five bands and return one of five fixed values. Both are defensible designs and either would have been fine. Only one of them is written down, and it is not the one that runs.
The consequence is not that the number is meaningless, it is that the number cannot be reasoned about. A turn that got two hundred milliseconds slower either moves the score by a whole step or does not move it at all, depending on which side of a band boundary it landed, so a trend line reads as a staircase and nobody can say whether the staircase is the system or the scoring. Anyone working from the documented definition will interpret that chart as a curve and draw the wrong conclusion from its flat stretches, which is worse than having no score, because a wrong reading arrives with confidence attached. The documentation and the implementation were both written by us, in the same file, and they have disagreed since the day the bands went in.
Tracing a guardrail decision
A guardrail decision is not a log line, and it is not a boolean. It is the single most reviewable thing the system does, and the shape you record it in determines whether a review is possible at all.
Our front door asks the model provider for the full assessment payload explicitly rather than accepting the summary verdict, and attaches it to the trace: which side of the exchange was evaluated, the input or the generated output, what the outcome was, which tier it fell into, and which policies matched. That is four fields, and every one of them is load-bearing. Without the side, you cannot tell a user who said something out of scope from an assistant that generated something out of scope, which are entirely different problems with entirely different remedies. Without the matched policies, you have a count of interventions and no way to argue about a threshold.
// A guardrail intervention is a trace-level fact, not a span-level one: it can
// fire on the way in, on the way out, or both. Accumulate and re-apply the
// whole set, because an update that replaces will discard the earlier one on
// exactly the turns worth reading.
assessments.push({
  side: verdict.side,          // input or generated output
  outcome: verdict.outcome,    // what it did, not merely that it fired
  tier: verdict.tier,
  policies: verdict.matched,
});

trace.update({
  tags: [...baseTags, "guardrail:intervened"],
  metadata: { guardrail: assessments },
});

// The same event, written a second time in a different shape. The trace is for
// reconstruction; this line becomes a metric with a threshold on it.
log.info(JSON.stringify({ event: "guardrail_intervened", side: verdict.side,
  outcome: verdict.outcome, tier: verdict.tier }));
The companion exhibit on layered guardrails makes the case for recording what an intervention did rather than only that it fired. The observability consequence is the one worth adding here: an intervention is a trace-level fact, not a span-level one, because it can happen on the way in, on the way out, or both, and it has to survive whatever else the trace records afterwards. Ours accumulates the assessments and re-applies the whole set on each update, which is a small detail with a sharp edge behind it: an update that replaces rather than appends will silently discard the earlier intervention on any turn where two fire, and the turns where two fire are the ones you most want to read.
The second thing the guardrail path taught us is that one event needs two sinks. The same intervention is written to the trace and emitted as a structured log line, which a log filter turns into a custom metric with an alarm on it. That is not redundancy. The trace exists to reconstruct one conversation months later and is queried by a human with a question. The metric exists to wake somebody up when the rate changes and is queried by a threshold. A system that only has the trace has no alerting; a system that only has the metric has a number nobody can explain. Write both, from the same event, at the same moment.
The turns that never reach a model
Here is the part that took us longest to see, and it is the reason to write about routing at all.
Our front door has deterministic routes that never reach a model. A distress response, matched on intent and answered with fixed copy. A quick-reply router that maps three button payloads to three fixed replies. Both are correct designs: neither should burn an inference call, and the distress path in particular must never be improvised by a model. Both return before any of the tracing exists, so neither produces a trace.
The consequence is that the trace store does not hold the traffic. It holds the traffic that reached the model. Every rate you compute from it has a denominator that quietly excludes the cheapest, fastest and in one case most sensitive paths through the system. Average latency looks worse than the service is. Cost per conversation looks higher than it is. And the one path where you would most want a record that it fired, and when, and what was returned, is the one path with no record at all.
The size of that hole is the number that decides how much any of this matters, and there is a nice irony in where that number has to come from. The trace store cannot tell you, because the turns it is missing are precisely the ones you are counting.
The remedy is not to trace everything at the same weight. It is to emit a minimal trace on every route, including the ones that return in a millisecond, carrying the session, the route taken, the reason it was taken and nothing else. A one-span trace is cheap. A missing one is a hole in the denominator that nobody discovers until they are asked to explain a rate.
This generalises past our own build. Any system with a fast path and a slow path will instrument the slow path first, because the slow path is where the interesting engineering is. The fast path is where the sampling bias comes from.
What it costs to watch
Two costs are in play and they are usually conflated: what a traced conversation costs to run, and what it costs to keep the traces.
The first is arithmetic the trace store cannot do for you. Token usage comes back from the provider; the price does not. Our front door computes cost per model call from a price table the application holds, multiplying returned token counts by a per-million rate, and writes the result on the span. That is the right division of labour, because the trace store has no idea what you are paying, and rates differ by model, by region and by contract.
It is also where our second defect lives, and it is the most ordinary failure imaginable. A price table default can be correct on the day it is written and wrong the day the served model changes. Both old and new rates can be published on the same provider price list, the recorded spend can remain plausible, and no alarm will fire unless the model identifier and pricing version are checked together. Nothing has to break for the number to be wrong in the safe-looking direction.
The lesson is not to be more careful. It is that a price table is a dependency with a version, and the model identifier is already on the span, so the two can be checked against each other mechanically. A cost figure computed from a rate that does not match the model on the same span is a defect a test can catch and a human will not.
The second cost is the one nobody budgets for, and at low volume it inverts the intuition completely. A self-hosted trace plane has a fixed cost: compute, a database and storage, running whether or not anybody sends a message. Model inference has a marginal cost that starts near zero. Reduced to the unit that actually travels into a business case, observability cost per traced conversation is fixed cost divided by the traced-conversation denominator, and it falls away as the denominator grows.
The third term is the one that is easiest to forget: self-hosting the trace plane is a data-residency decision as much as a cost decision. Trace payloads contain prompts, replies and whatever a person typed. Keeping that inside your own account boundary is a materially different posture from sending it to a third party, and it is worth making that argument explicitly rather than letting it arrive as a side effect of a build-versus-buy comparison.
How long a trace lives
Ask how long a trace should live and you will usually be told a number. Look at a real system and you will find several, set in different places by different mechanisms, none of which was ever compared with the others.
Ours, honestly counted: short-lived session records expire in minutes, extended slightly for a recognised caller. A saved voice transcript persists for months. Logs have their own fixed retention set in infrastructure. Lead records have no expiry at all. Trace retention is configured in the trace store by a different control and on a different schedule from every one of those. Four clocks, and a policy that exists nowhere as a single statement.
Two published positions are worth designing against, because between them they bracket the answer from both ends. From below, Article 19 of the EU AI Act requires providers of high-risk AI systems to keep automatically generated logs for at least six months, unless a longer period is set by other law. From above, Australian Privacy Principle 11 obliges an entity to destroy or de-identify personal information in certain circumstances once it is no longer needed, per the OAIC quick reference. Neither instrument is telling you a number for your trace store. Together they tell you the shape of a defensible answer: a floor set by the obligation to be able to explain what the system did, a ceiling set by the obligation not to keep a person's words longer than the purpose requires, and a written position saying where between the two you sit and why. Most systems have neither the floor nor the ceiling written down, which is why the conversation usually starts during an incident.
That is not sloppiness so much as accretion, and it is close to universal. Each clock was set correctly for its own store at the moment that store was added. The problem only appears when someone asks the question that spans them: if a person asks you to remove their data, what actually happens, and what is left behind.
The rule we would now design to is that the copy carrying the most personal information should sit under the shortest defensible clock, and every other clock should be justified against it in one document. In practice that inverts a common arrangement, because the trace store is usually both the richest copy and the one with the longest retention, on the grounds that analytics wants history. It can have history. It can have the spans, the timings, the costs, the routes, the policy decisions and the scores, all of which are what analysis actually runs on. What it does not need is an indefinite copy of what somebody typed.
Two smaller decisions in the same family are worth naming, because both are cheap when made early and expensive when retrofitted. Pin the components that handle conversation text to the same region, so the text a policy evaluates and the text a classifier reads rest in one jurisdiction rather than two. And give tracing its own kill switch, independent of the guardrail and independent of a deployment, so that turning off collection is a configuration change rather than a release.
Three defects, one cause
The three defects above are not really three problems. A cost computed from a stale price table, a per-turn score computed over session state, and a latency score documented as a continuous function and implemented as five steps all share a cause.
Each is a derived field. None of them is measured; every one is computed from something else that is measured, and each is stored next to the measurement as though it carried the same authority. Token counts came from the provider and are correct. The cost derived from them is wrong. The turn boundaries are correct. The score derived across them is wrong. The latency is correct. Its normalisation disagrees with its own documentation.
Raw observations tend to be right, because something external produced them and something external will notice if they are not. Derived fields tend to be wrong, because their only definition is the code that computes them, and that definition drifts silently against both the documentation and the thing it derives from. They deserve the same discipline as an API: a version, a written definition, and a test that recomputes them from the raw fields on the same span and fails when the two disagree. Every one of ours would have been caught in a morning by that test, and every one of them survived for months without it.
If you are instrumenting one
In the order the decisions actually have to be made, because several of them are hard to change later.
- Decide the session identifier before anything else and put it on every trace on every channel regardless of what shape that channel's traces take. It is the only join that survives a redesign.
- Open spans before the operation and close them with the result, so the slowest calls in your system are the ones with real timings rather than reconstructed ones.
- Emit a minimal trace on the deterministic routes as well as the model routes, or every rate you compute will have a denominator that excludes your fastest paths.
- Put the redaction boundary outside the instrumentation boundary and treat the truncation limits on span attributes as a policy decision reviewed by the people who own the policy.
- Compute cost yourself from a price table that is versioned and checked against the model identifier on the same span, and expect it to be the thing that silently goes stale.
- Write derived fields with the same discipline as a schema and test them against the raw fields they are derived from.
- Count your retention clocks before somebody makes you. There are more of them than you think, and none of them is the policy.
None of this is exotic and none of it is expensive. It is the difference between a system you can explain and a system you can only defend, and the gap between those two only becomes visible on the day somebody asks you what happened to them on Tuesday.